
Introduction
The World Inequality Report 2022 (released by Paris-based World Inequality Lab) states that India is one of the highly unequally distributed nation in terms of income and wealth in the world. Paris- based World Inequality Lab is a global research initiative which promotes the research and reports on global inequality dynamics. If the income of the poor people falls or rises by the same amount as it does for the rich, then it can be said that the income inequality has not changed. However, this might depend on multiple other factors as well. For say, 10% increase in the income of poor people in India is relatively less as compared to a 10% income increase even for middle-class or elite people. The proportion change might seem similar, but the absolute change is significantly larger and in India this gap will gradually increasing from the past couple of decades.
In the British period, India’s income inequality was very high since 1858. After India’s independence also, there was not many changes on the inequality graph. Some major policies like deregulation and liberalization led to increase more inequality in income and wealth during this period. Only 1% was benefitted from several reforms, which was implemented post-independence.
Over the past couple of decades, India’s income inequality gap is continuously increasing. Moreover, India’s gender inequality is also very high. The share of female labour is about 18% which is significantly very less as compared to male labour share of around 70%.
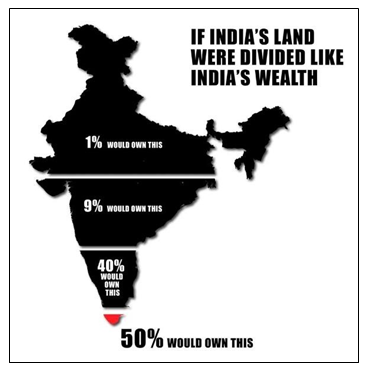
In India, top 15% individuals hold 80% of total national income whereas 50% individuals hold 13% total national income. This figure shows that India has becoming poor and one of the highly unequal countries in world. Rich are becoming richer and poor are continuously going down in terms of their standard of livings. Poor people are still lacking for good number of wages, proper education, and healthcare services.
The major reason behind income inequality is the unemployment. In India, direct and indirect taxes are quite high compared to other nations. Household-consumption expenditure survey which was conducted by the National Sample Survey (NSS) organization are the main source of poverty and inequality statistics in India. These surveys support the development of major data-driven policies in India and are used as a key element for the calculation or estimation of India’s Gross
Domestic Product (GDP) and India’s consumer price index (CPI). The latest NSS expenditure survey is publically available since 2011. As the Indian economy has been going through the significant changes since then, the release of the 2017- 18 round of the survey had been eagerly anticipated.
Definition of Income equality and inequality
Income equality in an economy refers that income is distributed equally among the population whereas inequality refers to the unevenly distribution of income among population. In India, income inequality is become crucial concern and the gap is increasing gradually.
India has not released any newer household consumption survey since the last NSS from 2011. It has not released any official estimates of poverty or any inequality for over a decade now. However, numerous scholars from worldwide have made several attempts to obtain estimates of how poverty and inequality may have evolved in India after 2011 using a variety of alternative (both official and non- official) data sources such as Edochi et al. (2022), Newhouse and Vyas (2019).
India’s inequality outlook
There are several kinds of inequalities in India that are complex in nature. While complex privation has been an area of study in the field of developmental economics since the early 2000s, complex complicated inequality is a new perspective. This kind of research aims to highlight the interrelationship between different variables such as income, labour, education, health, and household conditions, in order to emphasise on the level of deprivation. The harmony is like i.e. lack of one kind leads to household becoming deprived in other societies as well. It has both social and economic roots that support heavy structures that limit an individual’s potential and human rights. Economic factors like loss of employment, in-formalisation of work that takes away worker benefits, low incomes and having no assets or wealth cut across into the social lives by lowering their mobility and trapping the households in a vicious circle of scarcity.
It is tough to arrive at a single definition of a deprived household or vulnerability, but we can assume that a household devoid of essential means of survival or not having the purchasing capacity to access lifesaving or life-nurturing services can be called a deprived household. Must important, the idea of multidimensional inequality, beyond a methodological intervention, proposes compact solutions towards inequality. These solution lies amongst the inclusion of deprived
households in labour market so that the opportunities and sources of growth do not evade them for improving and enhancing social security.
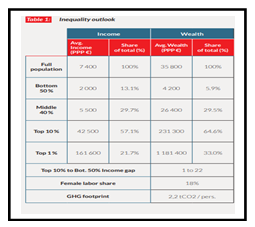
Various economic variables such as income, labour, and socio-economic factors (health, education, and household conditions) are highlighted as together these variables improves the standard of living. From past studies, it has been observed that the correlation between income, education and health is such that the lower incomes or loss of income leads to unaffordability and inaccessibility of services specially in the education and health sector. Periodic Labour Force Survey of India for 2017-18, 2018-19 and 2019-20 indicates that the top 10% of population earns approximately equal to the bottom 64% of population i.e., approximately one-third income earned goes to the top 10 account.
While uneven distribution of income is not the only trigger to descent into the poverty, it widely outlines the everyday experiences of inequality and inaccessibility. Basic needs become elite desires, spilling over in the form of resources which becomes inaccessible to the wider population. The income profiles have also shown huge wage difference between men and women, which leads towards gender-based inequities in labour market that marginalise women and narrow down their labour force participation rate.
See the above figure to understand the dynamics of wealth across different economic group. India’s gross national income at current price is about INR 230 Tn. Above is the table for India’s inequality outlook 2022.
Reasons for income inequality in India
There are several reasons behind the rise in income inequality in India, some of them are as follows:
- Unemployment is one of the major reasons for the increasing gap of income inequality in the country. The lack of employment gap is increasing as it has not been created in time is one of the crucial reasons why there is an income distribution gap today amongst population classes. This is also a vital cause for the low productivity of labour which can push many into poverty. It is a fact that inequality, poverty, and unemployment are significantly related to each other.
- Government’s high dependence on indirect taxes. The burden of indirect taxes tends to be on the higher side as percentage of income from those on a lower income group.
- High cost of education and healthcare services. This gradually convert to the burden in terms
of the higher number of debts and loans taken by the ordinary people, which cripples their standard of living and growth.
- The increase in the rentier class that focuses to maximise its leverage towards fixed assets say, property and land to extract as much as wealth and income as possible.
A study (2019) by the Reserve Bank of India stated that housing affordability has significantly deteriorated over the last four years, it is unsurprising how millennials now prefers on rent rather than increasing burden of higher EMIs. Moreover, during inflation, less profit is made, and wage earners are the ones who bear the losses. While revenues and profits are on the upper side, the wages have remained unchanged. Also, when the absolute money income rises, the real income decline which leads to fall in the overall growth and standard of living.
Measures of Income Inequality
a. The Gini Co-efficient b. the Lorenz Curve
We can measure inequality by Gini Coefficient that varies 0 to 1. ‘0’ represents even distribution or we can say perfect equality whereas ‘1’ represents uneven distribution or we can say perfect inequality. It known as Gini index or Gini ratio which measure income inequality or the wealth inequality within a nation. The Gini coefficient, which was primarily derived from the Lorenz curve, is one of the widely used measure to capture the income inequality in a group or population.
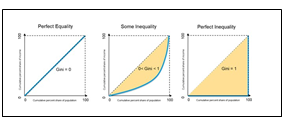
However, Lorenz curve shows the distribution of income or of wealth in a society. It is a mathematical representation derived from incomplete set of observation of income or of wealth. It gives clearer image of the inequality.

Below graph shows the Lorenz curve for net worth. X-axis is percentile of net worth. Y-axis is represented as the cumulative percentage of occurrences. The 45-degree upward slopping (dashed line) line shows that there exists perfect equality. Here, Lorenz curve is the curved one (solid line). Gini coefficient is the gap between solid line and dashed line.
c. Other tools to measures inequality
- Theil’s Index: Theil’s Index was explained by a Dutch econometrician Henri Theil (1924- 2000) at the Erasmus University Rotterdam. It is mainly used to measure economic inequality and racial segregation. Basically, this index TT is the maximum possible entropy of the data minus the observed entropy.
- The Atkinson Index: This index was developed by a British economist Anthony Barnes Atkinson. It is useful in determining which end of the distribution contributed most to the observed inequality.
- Dispersion ratio by deciles: the Palma Ratio: Palma Ratio came out from a Cambridge research Working Paper which stated that the income shares of the 50% of the population corresponding to the middle & upper-middles groups (deciles 5 to 9 of a country’s income distribution) tend to always get a similar share of income which is approximately 50% of the total income. Basically, this ratio is the share of all income received by the 10% people with highest disposable income divided by the share of all income received by the 40% people with the lowest disposable income.
Indian Government Initiatives/Steps to reduce income inequality:
There are many initiatives to reduce income inequality from our Governments such as Crash Scheme for Rural Unemployment, the Drought Prone Areas Programme, Food for Work Programme, self- employment schemes for engineers, employment scheme for educated unemployment etc. In 1978- 79 the Integrated Rural Development Programme (IRDP) was initiated during the sixth plan period
and post that Rural Landless Employment Guarantee Programme (RLEGP) and National Rural Employment Programme (NREP) were introduced. Some initiatives are below:
- Employees State Insurance Act which provides the insured workers various facilities like medical benefits, disability benefits, sickness benefit, maternity benefits and also benefit too dependent. As of now, all workers who are drawing wages of Rs.10,000 or less are covered in this scheme.
- Rozgar Mela- It is created to create more jobs for youth empowerment in national development. Recently, our Prime Minister has distributed
71,000 appointment letters to newly enlisted recruits in 45 places in India.
- Government has started to develop India’s service sector, which leads to be world’s manufacturing hub.
- Government has also launched Karmayogi Prarambh Module for online courses
- Ministry of health and Family Welfare introduced National Suicide Prevention strategy, which can lower suicide rate by 10 % by 2030 with multi sectoral collaboration.
- The first ever Biodiversity Heritage Site (BHS) is notified in Tamil Nadu as “Arittapatti Biodiversity Heritage Site”.
- Ministry of Consumers Affairs, Food and Public Distribution has launched “Online Consumer Reviews- Principle and Requirements for their Collections, Monetarization and Publications”.
-The National Commission for Protection and Child Rights has launched “Training Module for Chairperson and Members of Child Welfare Committee ”

It can’t be overlooked that irrespective of whatever measures were undertaken by the government in the past four decades, it has very little impact on narrowing down the gap of incomeinequalities and poverty in India.
Impact of Global Covid Crisis on Inequality
The pandemic has severely affected the poor group and impact the middle-class segment in terms of accumulated loss of saving and wealth. The Covid-19 pandemic and the economic crisis that followed hit all world regions, but this hit them with varying intensity. Latin America, Europe and Southeast and South Asia recorded the largest fall in their total national income in 2020 (i.e., between -6% to – 7.6%) whereas East Asia (despite of the pandemic began) succeeded in stabilizing its income level of 2020 same as of 2019. It is still too early for the systematic understanding of the country-wise impact of the crisis on wealth and income inequalities due to the lack of economic dynamics and the lack of real-time data on the distribution of income levels and growth across all countries. Moreover, between 2019 and 2021, the income and wealth of the top 0.001% group rises by ~14%, whereas the average global income and wealth is estimated to have increased by only 1%. The billionaire wealth globally increased by at least 50% during 2019-21.
On 18th May 2022, the state of Inequality in India Report was published which was written by Mr. Bibek Debroy, The Chairman and the
Economic Advisory Council to PMO. It showed that education and household conditions have improved tremendously caused by targeted efforts through few social protection schemes, mainly in the field of water and sanitation that leads to increase in standard of living. It is emphasised that the cognitive development and the education from the foundational years is a long- term corrective approach towards the inequality. During 2019-20, roughly 95% of the schools have fully functional toilet facilities within the school premises (96.9% functional girl’s toilets and 95.9% functional boy’s toilets). Roughly 80.16% of schools have the functional infrastructure such as running electricity connections with States and Union Territories like Chandigarh, Delhi, Goa, Tamil Nadu, Dadra and Nagar Haveli and Daman and Diu, Puducherry and Lakshadweep have also achieved universal (i.e., 100%) coverage of the fully functional electricity connections. The Gross Enrolment Ratio has witnessed an increase between 2018-19 and 2019-20 majorly at the primary, secondary and higher secondary standards. In terms of uplifting the household conditions, focusing on providing safe drinking water and access to sanitation leads to improved standard of living and a dignified life for most households.
Way Forward for India
- Government has to ensure that its policies address these causes and ensure the creation of a free and fair market which can be publically available.
- Quality of public services like health system and education system is also a great leveller and the Government must concentrate into it.
- A comprehensive plan towards improvement of inclusive standard of living and growth is the only way out to address the gap of income inequalities in India.
The tax/GDP ratio must be enhanced, with a large tax baseline. Rich group have to pay higher taxes in terms of the proportion to income.
- The inequalities among the Centre and States in finances should be narrowed down. India’s State budget respectively must have to be strengthened in order to improve the capital expenditures on tangible and physical infrastructure and spending on education, health, and social safety nets.
Conclusion:
Higher inequality indicates that the benefits from the economic expansion are not being distributed evenly and it signifies that the majority are going to a narrow group which itself comes under wealthy individuals. It also possesses a threat to the nation’s development and prosperity. The urge to the Indian government to take strong and immediate steps towards solving this issue. In the longer span, the higher level of inequality undermines impede development and social cohesion which leads to resulting in a larger resentfulness and dissatisfaction in the society. Globally, where roughly 82% of the income and wealth generated in previous year goes to the 1%, whereas ~3.7 billion people that accounts for the lower segment or the poorest half of the population saw negligible rise in their wealth, as per the survey. Also, Billionaire wealth has risen by an average of 13% a year since 2010 – six times faster than the wages of ordinary workers, which have increased by a yearly average of just 2%.


0 Comments